American Fisheries Society Family of Websites:

Journals
Read our five journals and Fisheries magazine
Gray Literature Database
Find thousands of unpublished agency reports and other information
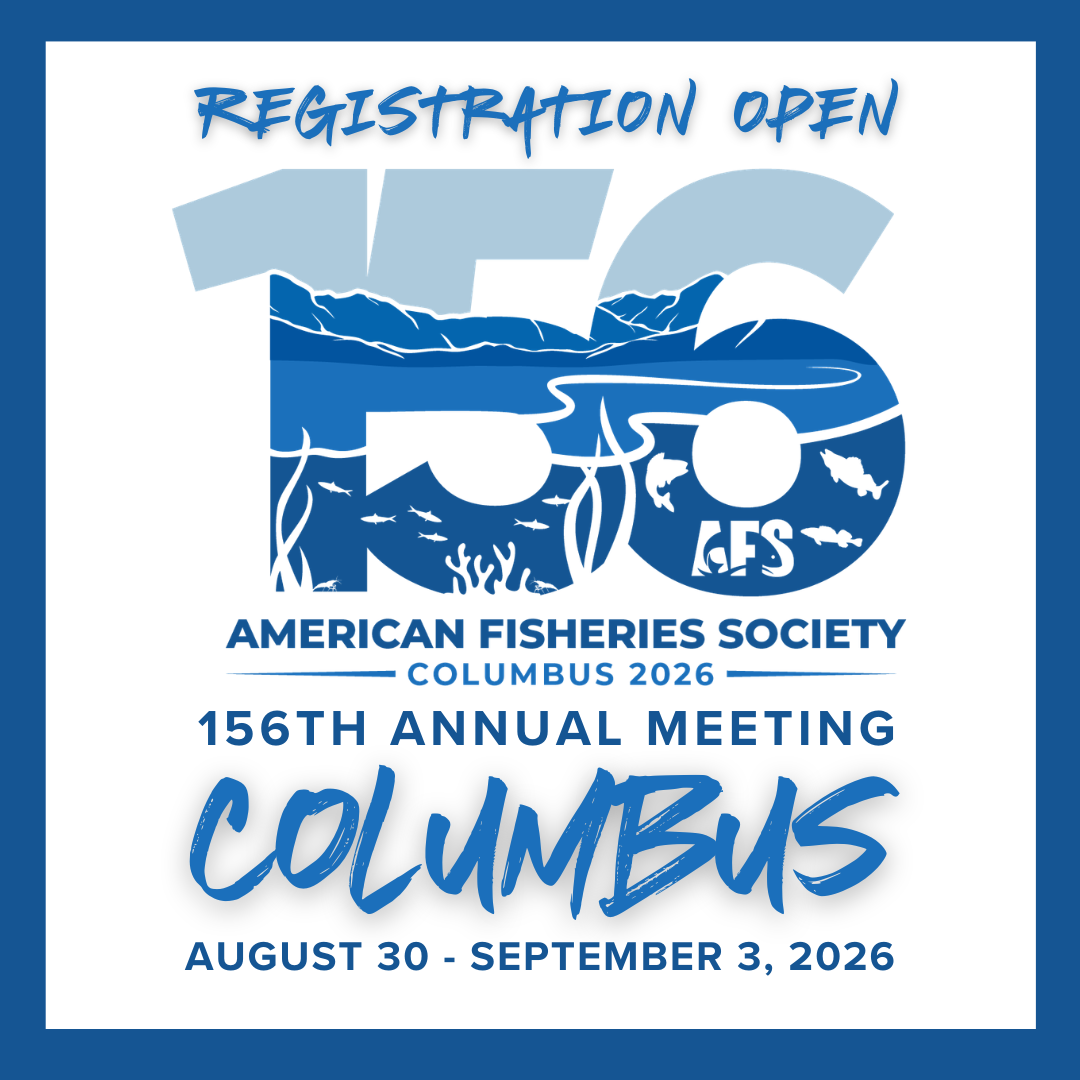
Annual Meeting
Join us in Columbus in 2026
Divisions, Chapters, Sections
Find an AFS Unit near you or in your area of specialty
Fishbook
Fisheries Collaboration Network
Climate Change and Fisheries
Learn how to communicate the effects of climate change on fisheries
Hutton Junior Fisheries Biology Program
Summer internships for high school students
Community Growth and Connections
Explore our initiatives to build community in the Society and in the fisheries profession
Center for Fisheries Technology and Collaboration
Find fisheries science products and services
Center for Technology and Collaboration
Quick answers to common questions