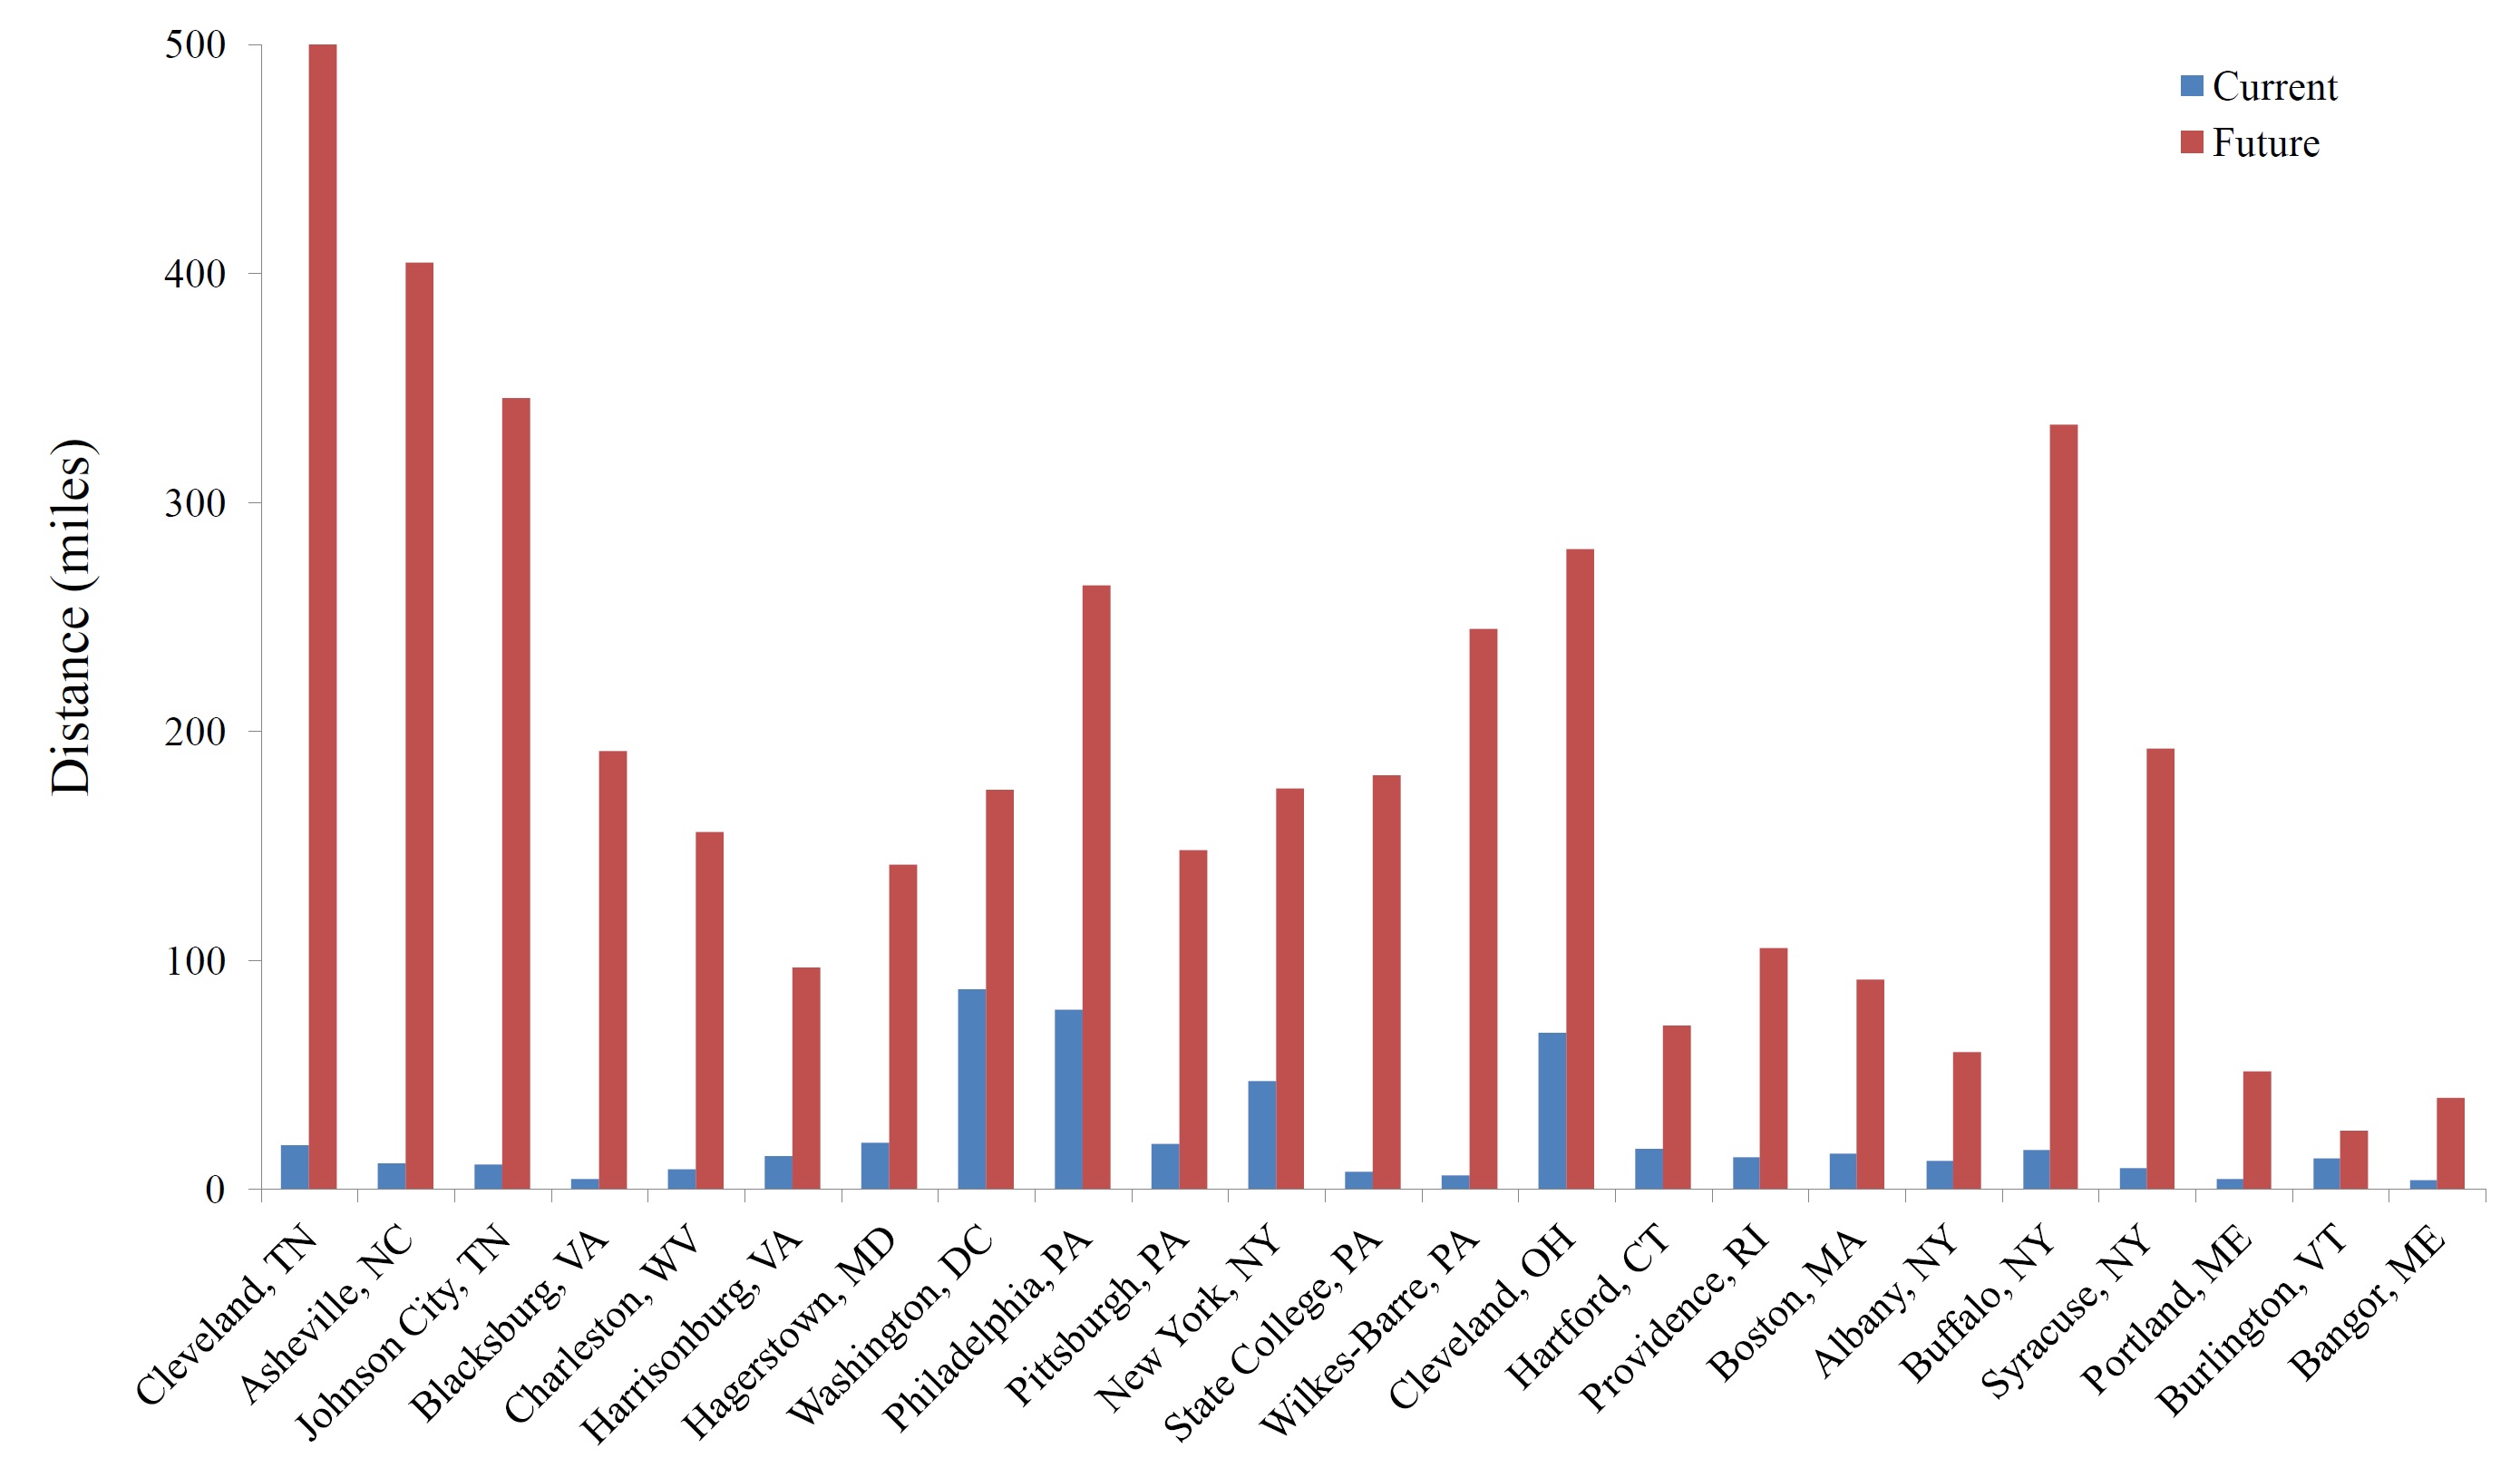
Jefferson T. DeWeberPennsylvania Cooperative Fish and Wildlife Research Unit, Pennsylvania State University, 413 Forest Resources Building, University Park, PA 16802. E-mail: jtdeweber@gmail.com Tyler WagnerU.S. Geological Survey, Pennsylvania Cooperative Fish & Wildlife Research Unit, Pennsylvania State University, University Park, PA 16802 Climate change is expected to result in widespread changes in species distributions (e.g., shifting, shrinking, expanding species ranges; e.g., Parmesan and Yohe 2003), especially for freshwater fish species (Heino et al. 2009). Although anglers and other resource users could be greatly affected by changes in species distributions, predicted changes are rarely reported in ways that can be easily understood by the general public. In contrast, climate science that more directly affects human welfare or livelihoods is often more readily communicated to the general public because it is of greater concern or closely related to everyday life. For example, most people can readily interpret how increases in the number of “hot” days above a given temperature threshold might affect their lives, and property owners in coastal areas can use predictive maps to determine how they might be affected by sea level rise (for more examples, see the Third National Assessment of the U.S. Environmental Protection Agency at globalchange.gov). However, the effects of climate change on species are usually reported to the general public using summary metrics or maps designed to communicate concepts that are not normally encountered in everyday life, including changes in habitat suitability, range shifts, or increasing risks from disease or extreme events (e.g., National Audubon Society 2009; Groffman et al. 2014). Though these metrics are necessary, meaningful, and understood by scientists, many people lack the necessary training and background to readily understand them. Further, scientists and nonscientists alike may struggle to convert these metrics into a currency that directly affects day-to-day life. Climate science is a complex issue, and we argue that when communicating potential responses of vegetation, fish, and wildlife to nonscientists, creative thinking with respect to the currency of communication will facilitate discussions between scientists, policy makers, and the public. We posit that with some additional thought and relatively simple summaries, the responses of fish and other species to climate change can be translated into everyday language that will facilitate climate science communication. Although such translations are rare, one example of this type of creativity is the translation from changes in habitat suitability for tree species to potential reductions in maple syrup production (Westover 2012), which is arguably more interesting and understandable for the general public. Similar translations could be especially important for communicating climate change effects on game fish and other species that are socially and economically important to large groups of people. We demonstrate this translation by communicating the potential effects of climate change on the distribution of a coldwater fish species, the eastern Brook Trout Salvelinus fontinalis. Rather than communicating the potential forecasted contraction of the Brook Trout’s distribution in terms of habitat loss, we report the predicted increases in the driving distance to streams likely offering Brook Trout angling opportunities under a climate change scenario. Travel costs based on distance have been widely used to value ecosystem services such as angling under climate change scenarios (e.g., Pendleton and Mendelsohn 1998; Mendelsohn and Markowski 1999; Ahn et al. 2000) but, to the best of our knowledge, have not been used for communicating potential changes to the public despite the intrinsic link to everyday life. BACKGROUND AND APPROACH The eastern Brook Trout is a socially and economically important fish that occurs in small coldwater streams and lakes. Wild populations support angling throughout the Appalachian Mountains and the northeastern United States. However, warming air temperatures are expected to reduce available coldwater habitat and result in a smaller Brook Trout distribution and fewer angling opportunities in the future. We used two previously developed models predicting river water temperature (DeWeber and Wagner 2014b) and Brook Trout occurrence probability (DeWeber and Wagner 2014a) to identify streams likely to support Brook Trout under current and future climate scenarios. We identified streams as likely to support Brook Trout if occurrence probability was greater than or equal to 0.46, which corresponded to the highest overall classification accuracy (DeWeber and Wagner 2014a). We did not include lakes in this analysis because occurrence predictions were only available for streams. We used projected air temperature from the downscaled ECHAM5 model described by Hostetler et al. (2011), which predicted region wide average increases of 7.1°F by 2087. We used the Google Maps API (developers.google.com/maps) to calculate the distance required to drive from the centers of 23 cities spread throughout the eastern Brook Trout range to the 10 nearest stream segments of the NHDPlus Version 1.0 Dataset (USEPA and USGS 2005) likely to have Brook Trout under current and future conditions. Distance calculations were automated in the ggmap package (Kahle and Wickham 2013) in R (R Development Core Team 2014). In cases where stream segments were not directly adjacent to a road and would likely require hiking, we simply report the distance to the nearest point along a road. We present the average distance required to drive from a city to the 10 nearest Brook Trout streams (for angling or viewing opportunities) as a simple and readily understood summary of the potential effects of climate change on Brook Trout occurrence and related resource use. INCREASES IN DRIVING DISTANCE Under current conditions, Brook Trout were predicted to occur in streams throughout the region, and average driving distances from cities to the nearest streams predicted to offer angling opportunities ranged from 4 to 87 miles (Figure 1). As a result of projected warming, driving distance to go Brook Trout angling was predicted to increase, on average, by almost 164 miles in the next 70–80 years (Figure 1). For example, the driving route from Philadelphia, Pennsylvania, to the nearest Brook Trout stream was predicted to cover 249 miles in a warmer future, much longer than the current 48 miles (Figure 2). Figure 1. Plots comparing the average distance to drive from 23 cities to the nearest 10 streams predicted to offer Brook Trout angling opportunities under current conditions and future warmer air temperatures projected under climate change. Cities are ordered based on their geographic location from left (southernmost) to right (northernmost). Warming air temperatures are predicted to result in widespread losses of Brook Trout habitat in the future, resulting in the longer predicted driving distances for anglers. The lengths of trips from many northern cities, such as Bangor, Maine, were predicted to increase but were still relatively short in the future because nearby streams were still predicted to support Brook Trout under warmer conditions. In contrast, anglers in southern cities (e.g., Cleveland, Tennessee; Figure 1) would experience dramatic increases in the lengths of trips because Brook Trout were predicted to be lost in surrounding areas. Figure 2. Driving routes connecting Philadelphia, Pennsylvania (point B), to the nearest stream predicted to offer Brook Trout fishing opportunities under current conditions (point A) and under future warmer air temperatures projected under a climate change scenario (point C). For many anglers in the region, predicted responses of Brook Trout to climate change means the difference between singleday fishing trips that could be made fairly often and multiday expeditions requiring significant planning and resources. In addition to longer drives, anglers would also likely have to plan on hiking because many of the streams predicted to offer Brook Trout angling opportunities in the future are located in relatively remote, protected lands away from roads. Although anglers tend to be very dedicated, it is unlikely that many would drive great distances to fish very often due to cost, especially if those last remaining streams become popular (Hunt 2005). Even so angling opportunities near city centers would likely be available for other species, and streams could still be stocked to provide seasonal Brook Trout angling opportunities; however, anglers who prefer to catch wild Brook Trout might target alternative species or stocked fish with less enthusiasm and effort. In any case, losses of Brook Trout populations and increased trip lengths would likely result in reduced resource use in many areas. SUMMARY Longer trip lengths for Brook Trout angling clearly demonstrate how a species response to climate change can be communicated in everyday language for the general public. We chose to focus on the length of angling trips because longer driving distances resulting from losses of Brook Trout populations would greatly affect anglers. Similar translations can be provided for a broad range of climate change effects on species and ecosystems by identifying affected resource users and a relevant, everyday currency. Additional examples of broad interest to diverse groups of people include driving times to observe other wildlife, the likelihood of viewing or harvesting a trophy-sized game animal in a specific location, or the number of bird species that might appear at a backyard feeder. These everyday metrics could be summarized with minimal effort once the difficult part of predicting species responses to climate change is complete and a relevant everyday currency that resource users base decisions upon is identified. Communicating species responses to climate change in everyday language could greatly increase the ability of resource users and other members of the general public to understand and relate to predicted changes. A clear understanding of potential changes might not lead to greater societal concern about species responses but may enable people to make informed decisions. In any case, people are unlikely to be concerned about effects that they do not understand. ACKNOWLEDGMENTS We thank Matt Marshall and three anonymous reviewers for helpful comments on an earlier version of this article. FUNDING Funding for this research was provided by the U.S. Geological Survey, National Climate Change, and Wildlife Science Center. Any use of trade, firm, or product names is for descriptive purposes only and does not imply endorsement by the U.S. Government. REFERENCES Ahn, S., J. de Steiguer, R. Palmquist, and T. Holmes. 2000. Economic analysis of the potential impact of climate change on recreational trout fishing in the southern Appalachian Mountains: an application of a nested multinomial logit model. Climatic Change 45:493–509. DeWeber, J. T., and T. Wagner. 2014a. Predicting Brook Trout occurrence in stream reaches throughout their native range in the eastern United States. Transactions of the American Fisheries Society 144:11–24. ———. 2014b. A regional neural network ensemble for predicting mean daily river water temperature. Journal of Hydrology 517:187–200. Groffman, P. M., P. Kareiva, S. Carter, N. B. Grimm, J. Lawler, M. Mack, V. Matzek, and H. Tallis. 2014. Ecosystems, biodiversity, and ecosystem services. Pages 195–219 in J. M. Meilillo, T. Richmond, and G. W. Yohe, editors. Climate change impacts in the United States: the Third National Climate Assessment. U.S. Global Change Research Program. doi:10.7930/J0Z31WJ2. Heino, J., R. Virkkala, and H. Toivonen. 2009. Climate change and freshwater biodiversity: detected patterns, future trends and adaptations in northern regions. Biological Reviews 84:39–54. Hostetler, S. W., J. R. Alder, and A. M. Allan. 2011. Dynamically downscaled climate simulations over North America: methods, evaluation, and supporting documentation for users. United States Geological Survey, OpenFile Report 2011-1238. Available: www. pubs.usgs.gov/of/2011/1238. (July 2014). Hunt, L. M. 2005. Recreational fishing site choice models: insights and future opportunities. Human Dimensions of Wildlife 10:153– 172. Kahle, D., and H. Wickham. 2013. ggmap: a package for spatial visualization with Google Maps and OpenStreetMap. R package version 2.3. Available: CRAN.R-project.org/package=ggmap. (July 2014). Mendelsohn, R., and M. Markowski. 1999. The impact of climate change on outdoor recreation. Pages 267–288 in R. Mendelsohn and J. E. Neumann, editors. The impact of climate change on the United States economy. Cambridge University Press, Cambridge, U.K. National Audubon Institute. 2009. Birds and climate change: ecological disruption in motion. National Audubon Society, New York. Available: birds.audubon.org/sites/default/files/documents/ birds_and_climate_report.pdf. (July 2014). Parmesan, C., and G. Yohe. 2003. A globally coherent fingerprint of climate change impacts across natural systems. Nature 421:37– 42. Pendleton, L. H., and R. Mendelsohn. 1998. Estimating the economic impact of climate change on the freshwater sportsfisheries of the northeastern U.S. Land Economics 74:483–496. R Development Core Team. 2014. R: a language and environment for statistical computing. R Foundation for Statistical Computing, Vienna, Austria. USEPA (U.S. Environmental Protection Agency) and USGS (U.S. Geological Survey). 2005. National hydrography dataset plus version 1.0, NHDPlusV1. Available: horizon-systems.com/NHDPlus/NHDPlusV1_ home.php. (May 2014). Westover, R. H. 2012. Changing climate may substantially alter maple syrup production. United States Department of Agriculture Blog. Available: blogs.usda.gov/2012/09/11/changing-climatemay- substantially-alter-maple-syrup-production. (September 2014).
Recent News
This website uses cookies to improve your experience. AcceptRead More
Privacy & Cookies Policy
Privacy Overview
This website uses cookies to improve your experience while you navigate through the website. Out of these, the cookies that are categorized as necessary are stored on your browser as they are essential for the working of basic functionalities of the website. We also use third-party cookies that help us analyze and understand how you use this website. These cookies will be stored in your browser only with your consent. You also have the option to opt-out of these cookies. But opting out of some of these cookies may affect your browsing experience.
Necessary cookies are absolutely essential for the website to function properly. This category only includes cookies that ensures basic functionalities and security features of the website. These cookies do not store any personal information.
Any cookies that may not be particularly necessary for the website to function and is used specifically to collect user personal data via analytics, ads, other embedded contents are termed as non-necessary cookies. It is mandatory to procure user consent prior to running these cookies on your website.