News
WOTUS Hearing Update
The House Science, Space and Technology’s Subcommittee on the Environment held a hearing to discuss the future of the Waters of the U.S. Rule or “WOTUS” rule on Wednesday, November

Quick answers to common questions
The House Science, Space and Technology’s Subcommittee on the Environment held a hearing to discuss the future of the Waters of the U.S. Rule or “WOTUS” rule on Wednesday, November
In recent months, talk of offshore aquaculture has been buzzing in the news and in Washington. While finfish and shellfish culture has flourished in state waters for more than a
The House Science, Space and Technology’s Subcommittee on the Environment is scheduled to discuss the future of the Waters of the U.S. Rule or “WOTUS” rule on Wednesday, November 29,
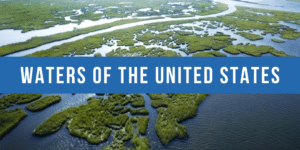
In June, the EPA and the U.S. Army Corps of Engineers announced the proposed repeal of the 2015 Clean Water Rule in anticipation of replacing it with a narrower definition
On November 15, the USDA Forest Service released Rise to the Future: National Fish and Aquatic Strategy. In the 30 years since the inception of Rise to the Future, the
Sorry, but you do not have permission to view this content. Members may Log In to view it. If you are unable to view the content after logging in, please click the “refresh” button on your browser and try again, or clear your browser cache and try again.

President Trump’s push for a US$1 trillion infrastructure package offers an opportunity to pursue benefits for aquatic resources. Most infrastructure is inextricably connected to water.
On October 27, the South Atlantic Fishery Management Council announced open commercial and recreational fisheries for Red Snapper. The recreational season opened in federal waters of the South Atlantic for
AFS was heavily involved in planning the Coastal and Estuarine Research Federation’s (CERF) biennial conference in Providence on November 5-9 and several AFS members had important roles at the event.
Chairman John Barrasso (R-Wyo.) and Ranking Member Tom Carper (D-Del.) of the Senate Environment and Public Works Committee along with Reps. Hakeem Jeffries (D-N.Y.), Rob Wittman (R-Va.), Frank LoBiondo (R-N.J.),